
1x
✕
✕
Settings
Show current date check_box_outline_blank
Show current date check_box_outline_blank
Mapping Perspective
Visualization for Simulating Limited Intelligence
Leaders of the past have made influential decisions based upon limited and potentially unreliable information. The goal of this project is to re-examine how limited strategic intelligence has had a large historical impact.
Mapping Perspective is a Digital Humanities project to analyze historical events contextually by mapping the limited viewpoints of historical figures and organizations. We chose the invasion of Normandy to showcase our mode of analysis, due to the extensive deception tactics involved. The visualization will allow us to simulate the relative amount of intelligence of both alliances in order to analyze the decisive factors that lead to the Allies' ultimate victory.
How did leaders make decisions based upon limited information? Why did they act as they did? These are some of the question that our project seeks to answer.
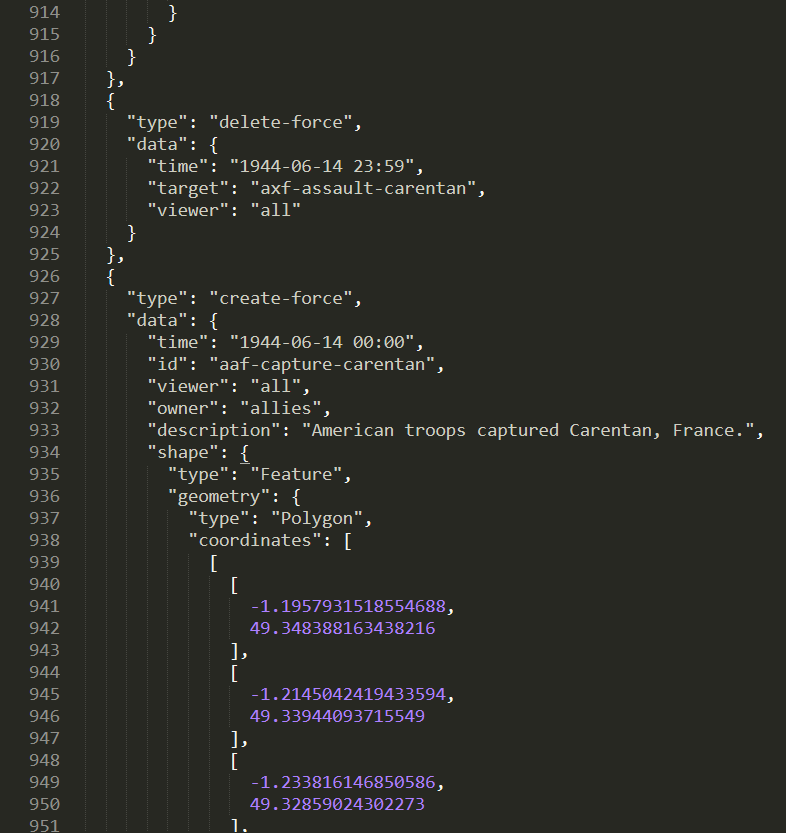
The goal of Mapping Perspective is to analyze the effect that limited knowledge had on the decisions made by the Allied and Axis powers of World War II. However, no existing software was suited to the task, and information was rarely available in sufficient detail from any one source. As a result, we built software for the visualization from the ground up using Leaflet to render the map layers, Mapbox to provide the map imagery, and a custom user interface and event playback system. Lastly, we compiled the data for the events shown in the visualization by hand from numerous sources.
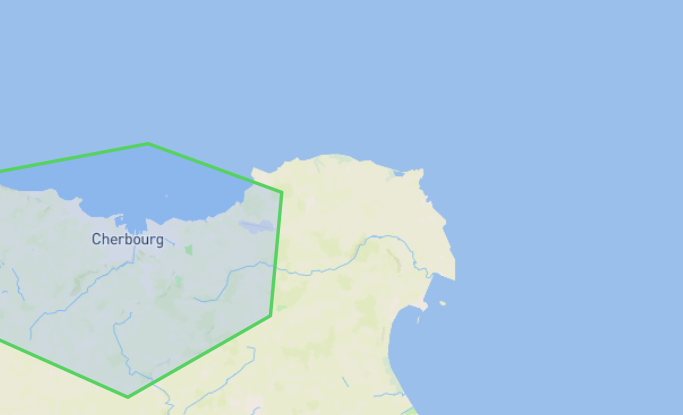
Unfortunately, precise geographic data is limited, and aspects of the map are tailored for our data set. The regions shown on the map are approximate and have no relation to the strength of a force. The size of each region lends itself to the approximation and overall geographic coverage of a unit.
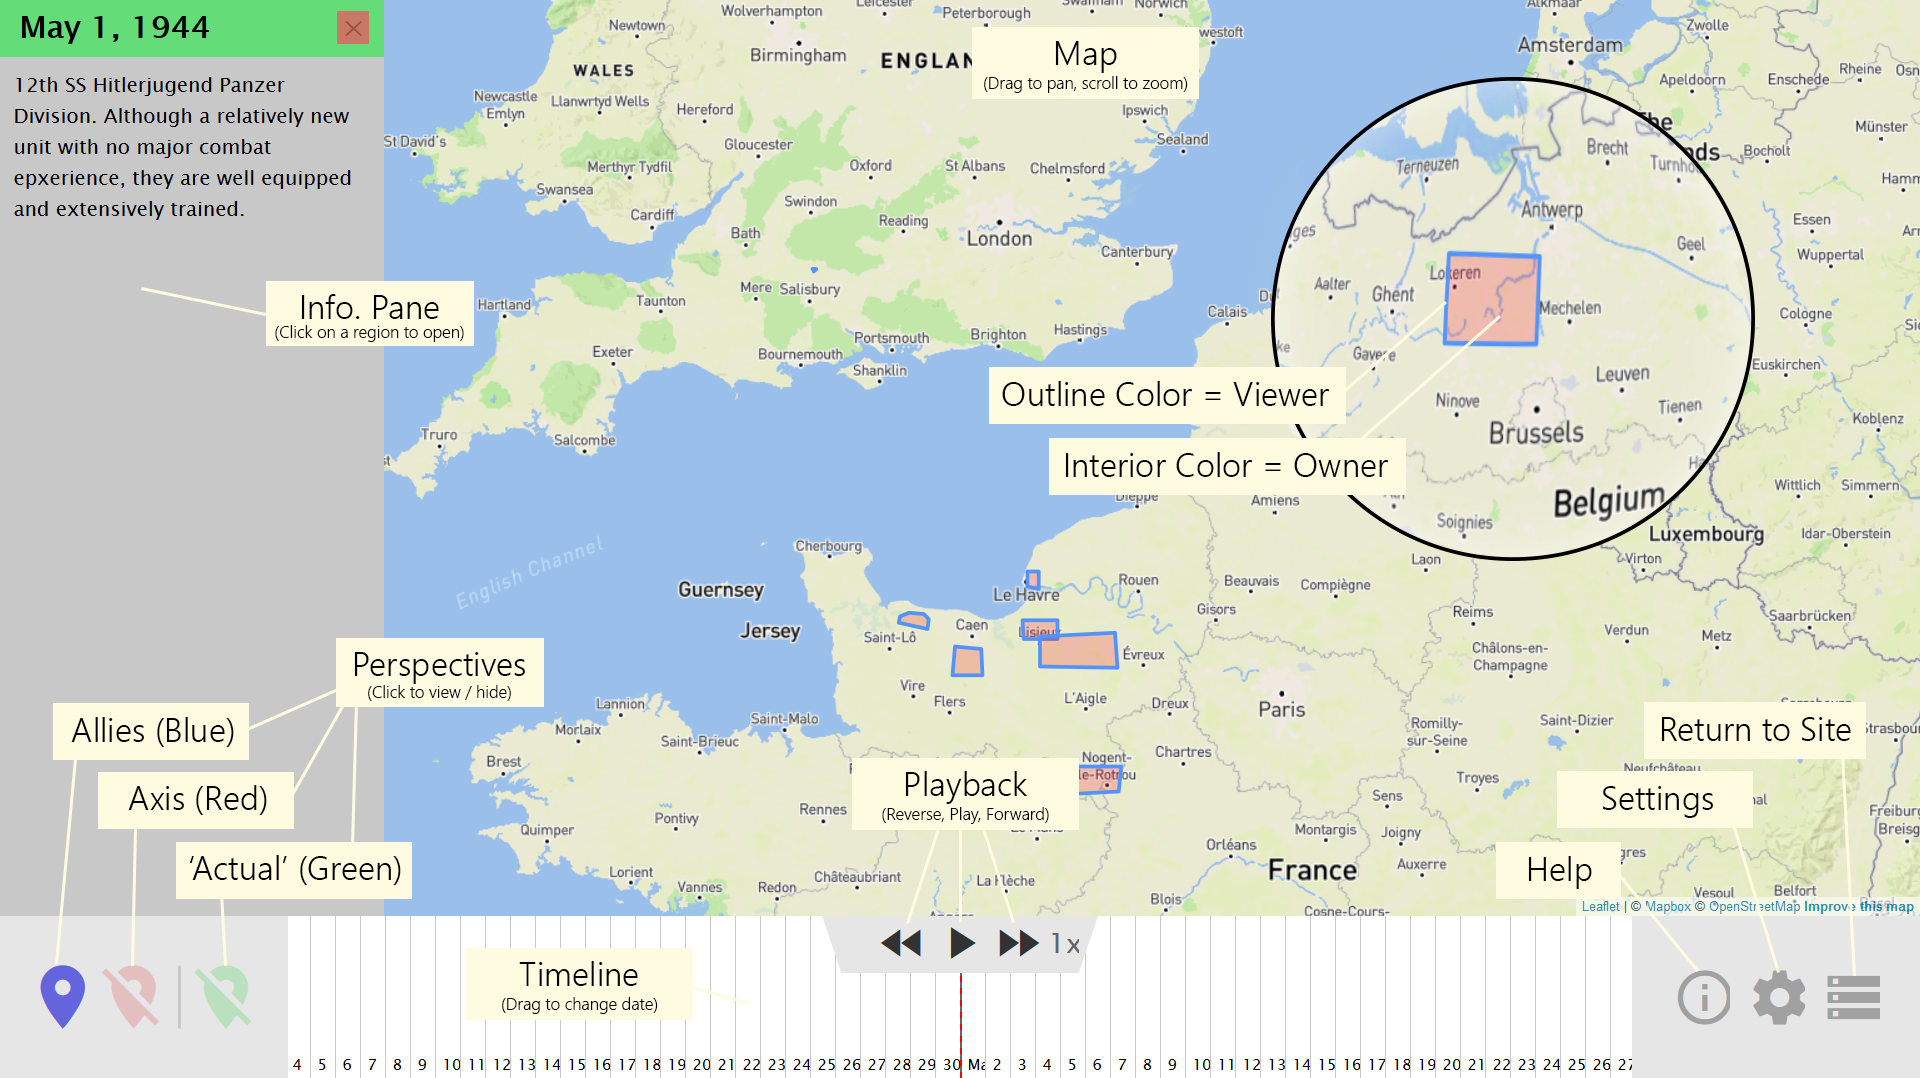
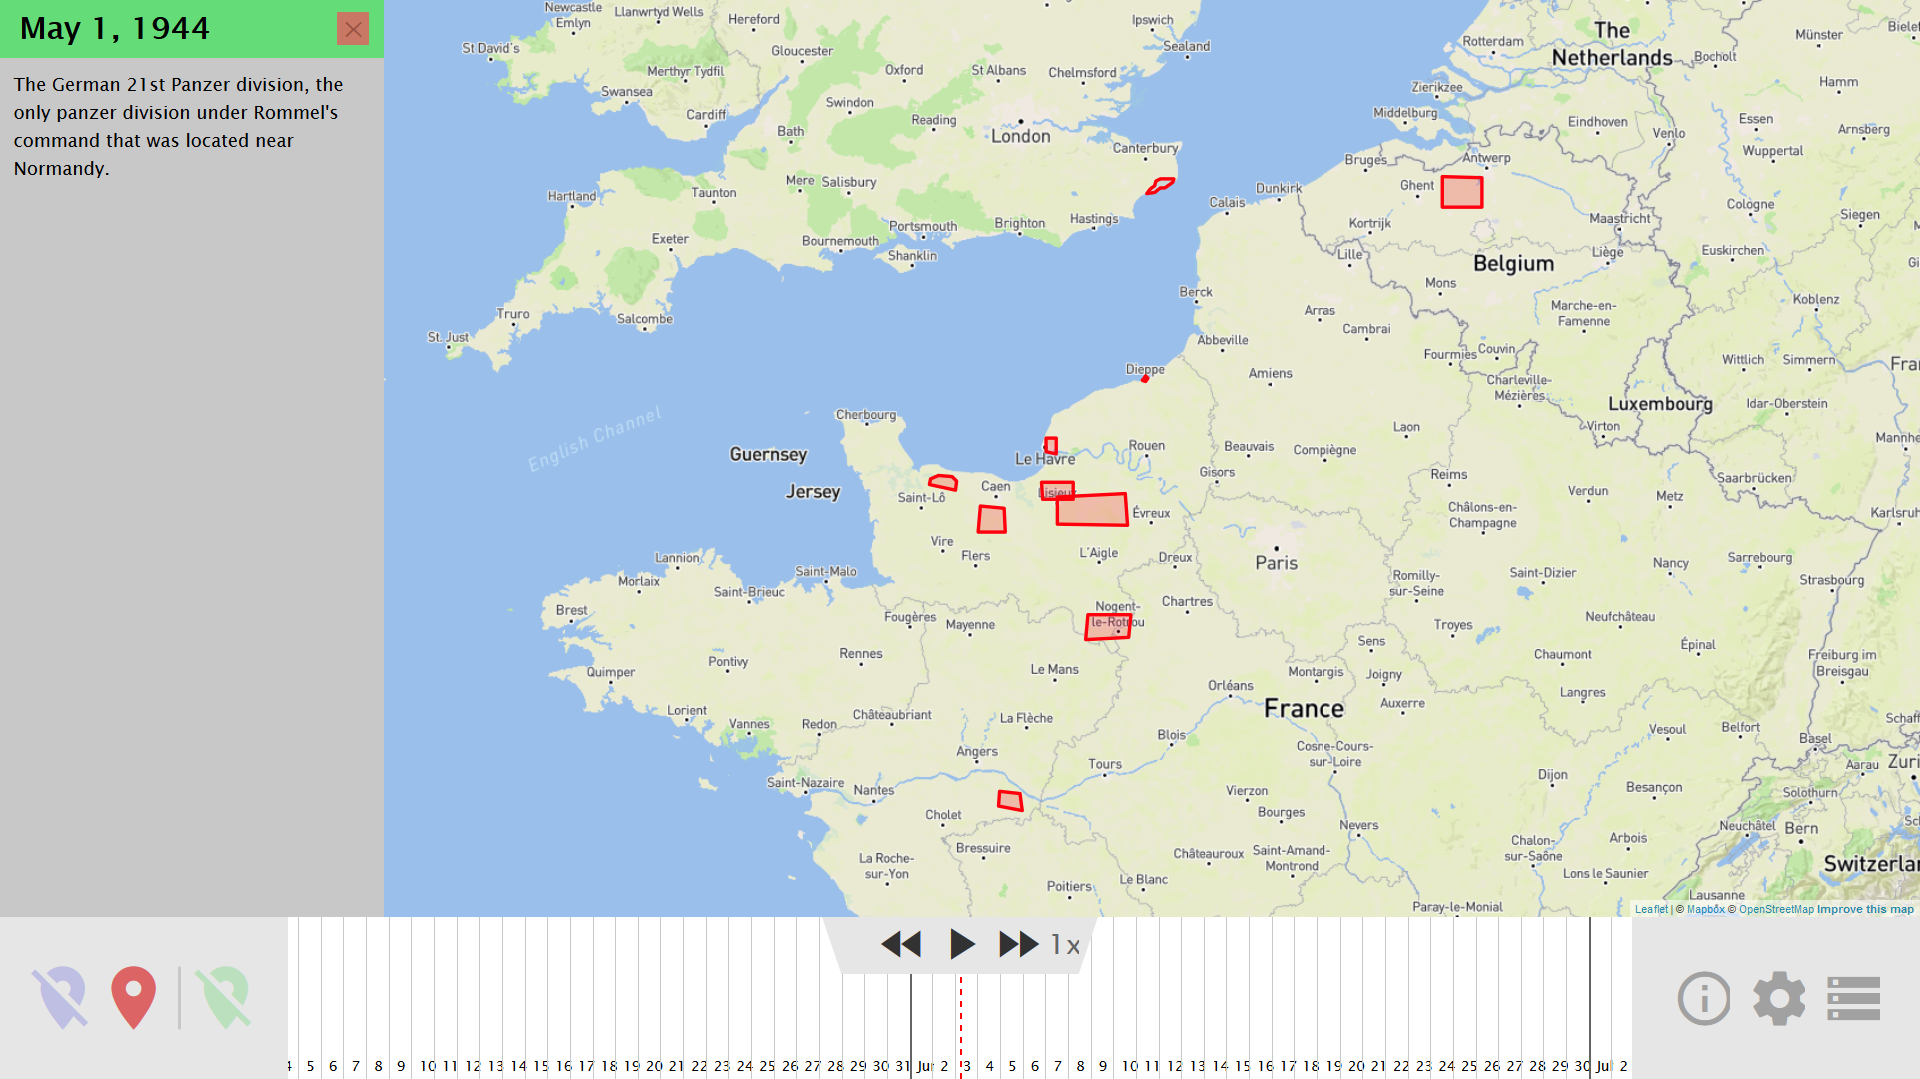
To showcase the limited intelligence of each faction, Mapping Perspective provides a map that allows the user to view the Normandy landings from 3 different viewpoints. One viewpoint is provided for each faction, with one additional viewpoint that shows what actually happened, synthesizing documents from both sides as well as postwar documents. At this point, the project and its aspirations are new, and gegraphical data is sparse considering the scale of the invasion, but it is sufficiently developed to showcase its usefulness to the classroom, as well as related research as a mode of analysis.
The deception tactics undertaken by the allies no doubt played a major part in the success of the Normandy landings. While the superior naval firepower, air supremacy, and intelligence-gathering capabilities of the Allies meant that a landing against a well prepared German defense might ultimately be successful, the deception tactics significantly reduced the casualties taken by the Allies. This conclusion is supported by the significantly higher Allied casualties and slower advance in areas where the German defenders were present. Additionally, the German military was not, on the whole, tactically inept, as evidenced by their rapid response once the invasion was noticed. However, due to the deceptions, many German military units were located a significant distance from Normandy and were unable to join the battle for days. This gave the Allies the time they needed to capture and fortify territory after penetrating the relatively sparse German defenses. Additionally, the German units were extremely vulnerable to Allied bombing when in transit and took significant damage as a result, if not severely slowed in clear weather.
Below is an example of the JSON format used for time, locaiton, and semantic data.
One of the bottlnecks that we anticipated was scarce information for extracting both spatial and temporal data concerning the events at and surrounding Normandy. Our estimation proved to be grossly wrong. In fact, there was (and is) so much information, that to skim through it all would take a lifetime. From our research, we found many primary sources as well as compiled narratives; however, none would provide a quickly accesible format from which we could extract data. Additionally, due to the time constraints of the project, we were unable to process the sources, including the many books and physical archives such as this one, beyond those available on the open web. Our compromise of these constraints was to obtain an even sampling of the various aspects of the Normandy landings and focus on a global narrative, rather than individual ones.
Another problem we anticipated was heavy bias of existing sources to record the Allied perspective in the war. As Churchill said, "History is written by the victor." Nonetheless, although an obstacle, the German perspective has not been entirely forgotten, and the concern for its preservation is not solely ours. Many of the relevant sources share the same problems with those of the Allies, and, admittedly, several of the events that we've mapped rely on German records obtained after their defeat which indicate that deception tactics of the Allies were effective.
Data collection for the specificities of historical events is a monstrous task, and to improve the process would be a much needed improvement to any project, including our own.
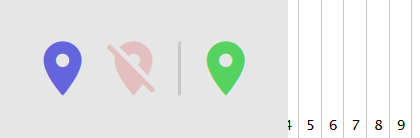
Mapping Perspective is meant to be accessible to a wide audience, and, as a result, several key decisions throughout the design process reflect this goal. The interface was kept visually simple, with all the necessary controls located towards the edges of the screen to avoid obscuring the map. The homepage was kept deliberately simple and aesthetically appealing as well to welcome a wider audience. We consistently added features with compatibility in mind, referencing standards supported by the major browsers like Firefox and Google Chrome. Due to the time constraints placed on development, Mapping Perspective has not been tested extensively on nor optimized for older browsers or mobile devices. (The project only targets viewing on laptops and desktops at this time). The symbols chosen for the various controls are meant to mimic those commonly seen when using other software such as online video players and maps, helping to make the project easier to approach and use. Colors were chosen to convey faction and viewer information because they are easily understood and aesthetically appealing.
To facilitate the collection of data, we implemented a system to automatically determine the “accuracy” of a force or event. That is to say, if the viewer and owner of a force are one and the same, then the force is deemed “accurate” and appears as such in the corresponding map layer. This is an example of one of the many compromises that we chose to make in order to balance the speed of development with the level of accuracy in our final product.
An overwhelming portion of the effort that went into this project was dedicated to creating the platform for our visualization. We anticipate that it will be useful to applications beyond the landings at Normandy and hope that it inspires future research. The source code is published under the MIT license on GitLab.
Download on GitLabCreated at the University of Texas at Dallas, Fall 2017.
By Benjamin T. Fields and Noah C. Parker.
Created for the Digital Humanities. Thank you, Dr. Wright.